
There are hardly any complex consumer products in the market that are truly made in one region. The auto industry is no exception. Even the TESLA Model S and X, the only vehicles claiming 100% assembly in the U.S., use outside suppliers for components such as the Canadian Auto Parts supplier, Magna International and Mexican Lithium miners Bacanora Minerals. 5
Global trade may date back as far as the silk road or perhaps prior, but more structured trade agreements have been put in place in the 20 th century between 2 or more regions allowing for import and export of goods to provide consumers with broader product options and at times lower prices. One of these key agreements was put in place in January of 1994 between the three North American nations, Canada, United States and Mexico. The agreement is known as NAFTA (The North American Free Trade Agreement).
The United States commenced bilateral trade negotiations with Canada more than 30 years ago, resulting in the U.S.-Canada Free Trade Agreement, which entered into force on January 1, 1989. In 1991, bilateral talks began with Mexico, which Canada joined. The NAFTA followed, entering into force on January 1, 1994. Tariffs were eliminated progressively and all duties and quantitative restrictions, with the exception of those on a limited number of agricultural products traded with Canada, were eliminated by 2008. 6
Starting in 2015, NAFTA became a household name as it was a key topic in the center of then, Republican presidential candidate and current U.S. president, Donald Trump. His beliefs are that NAFTA has brought more harm to the U.S. economy than benefit and should be terminated. The key reason being the loss of manufacturing jobs in U.S. as many automotive companies have moved operations outside of U.S. under this agreement. 1
Many industry leaders however believe that NAFTA, though not perfect, has been a key contributor the growth of trade in U.S. over the span of its quarter of a century existence and demolishing it without considering all the consequences will cause significant harm to the auto industry and the U.S. economy as a whole. This is a view shared not only by key automakers in the U.S. (i.e. Ford, GM, Toyota, etc.), but also the sector’s key suppliers, such as Magna International. 2,3,4 (Exhibit 7)
Magna International Inc.
Magna, a Canadian company, is a leading global automotive supplier with 328 manufacturing operations and 99 product development, engineering and sales centers in 29 countries employing over 163,000 individuals, of which, 160 facilities and over 75000 employees work in the NAFTA region (Exhibit 1). Magna is positioned in the middle of the overall auto industry supply chain as it needs to source parts and supply parts to companies within the NAFTA region. 7
One of the key strategic factors contributing to Magna’s growth and success in the industry has been its agility and flexibility to serve its customers. Their manufacturing sites are often within close proximity of their key suppliers and as a result, they have expanded beyond Canada and have opened many facilities in US & Mexico to serve customers in those regions (i.e. BMW in SC, GM & potentially BMW in San Luis Potosi, MX). 8
Impact of demolishing NAFTA
Due to the existence of NAFTA, automakers have been able to leverage the lowest parts and labor cost in manufacturing and providing the consumer with the most value for the product. If NAFTA was to demolish and high tariffs were to be added to products imported to the U.S. from Mexico and Canada, the exports would take a hit as well. For example, Magna announced in December of 2016 that it had won BMW’s business for seating products in South Carolina and they plan on opening a 4 th manufacturing location in that state employing up to 480 people. 7
Magna also has facilities in Mexico which will likely supply the BMW facility in San Luis Potosi, MX. 8 U.S. will import BMW 300 series from Mexico while exporting BMW SUV’s produced in South Carolina to Mexico and Canada. In the short to medium term, Magna will continue operations as is and if tariffs are risen, they will have to pass the cost on to the consumers as moving numerous facilities will result in massive capital expenditure and will not be feasible.
My recommendation would be for Magna to actively work with the auto industry in North America to use their collective voice and work with law makers at the state level to ensure the agreement is improved rather than terminated as it will be the only win-win situation.
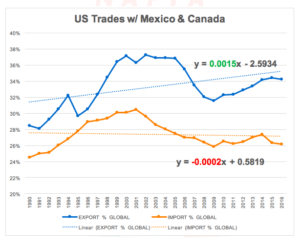
Historical trade data from the United States Census Bureau shows the direct correlation between Import & Export and is kept by country on a monthly basis. Tables and graphs in Exhibits 2 through 6 capture this data since 1990. 9 Arguably reducing import from NAFTA regions will not yield higher jobs in the U.S. and eventually higher exports.
Exhibit 1 Magna’s Facility & Employee Distribution in NA
| Headquarter | Manufacturing / Assembly | Engineering / Sales / Product Development | Employees | |
| CANADA | 1 | 50 | 11 | 21575 |
| UNITED STATES | 1 | 58 | 13 | 24900 |
| MEXICO | 0 | 31 | 1 | 29125 |
Source: Company Website
| TABLE 1: US Global Trade Value ($ millions USD) | |||
| YEAR | EXPORTS | IMPORTS | BALANCE |
| 2016 | 1,451,011 | 2,187,805 | (736,794) |
| 2015 | 1,503,102 | 2,248,183 | (745,082) |
| 2014 | 1,621,874 | 2,356,356 | (734,482) |
| 2013 | 1,578,517 | 2,267,987 | (689,470) |
| 2012 | 1,545,821 | 2,276,267 | (730,446) |
| 2011 | 1,482,508 | 2,207,954 | (725,447) |
| 2010 | 1,278,495 | 1,913,857 | (635,362) |
| 2009 | 1,056,043 | 1,559,625 | (503,582) |
| 2008 | 1,287,442 | 2,103,641 | (816,199) |
| 2007 | 1,148,199 | 1,956,961 | (808,762) |
| 2006 | 1,025,968 | 1,853,938 | (827,971) |
| 2005 | 901,082 | 1,673,454 | (772,372) |
| 2004 | 814,875 | 1,469,705 | (654,830) |
| 2003 | 724,771 | 1,257,121 | (532,350) |
| 2002 | 693,101 | 1,161,366 | (468,265) |
| 2001 | 729,101 | 1,140,998 | (411,898) |
| 2000 | 781,918 | 1,218,023 | (436,105) |
| 1999 | 695,797 | 1,024,616 | (328,819) |
| 1998 | 682,139 | 911,897 | (229,758) |
| 1997 | 689,180 | 869,703 | (180,523) |
| 1996 | 625,073 | 795,287 | (170,213) |
| 1995 | 584,740 | 743,545 | (158,805) |
| 1994 | 512,625 | 663,252 | (150,627) |
| 1993 | 465,090 | 580,656 | (115,566) |
| 1992 | 448,165 | 532,662 | (84,497) |
| 1991 | 421,730 | 488,453 | (66,723) |
| 1990 | 393,592 | 495,311 | (101,718) |
| AVERAGE | 931,184 | 1,405,875 | (474,691) |
| Source: United States Census Bureau – Foreign Trades | |||
| Note: Figures are not seasonally adjusted | |||
| TABLE 2: US Trade Value w/Mexico ($ millions USD) | |||
| YEAR | EXPORTS | IMPORTS | BALANCE |
| 2016 | 229,702 | 294,056 | (64,354) |
| 2015 | 236,204 | 296,401 | (60,197) |
| 2014 | 241,007 | 295,730 | (54,723) |
| 2013 | 225,954 | 280,556 | (54,602) |
| 2012 | 215,875 | 277,594 | (61,719) |
| 2011 | 198,289 | 262,874 | (64,585) |
| 2010 | 163,665 | 229,986 | (66,321) |
| 2009 | 128,892 | 176,654 | (47,762) |
| 2008 | 151,220 | 215,942 | (64,722) |
| 2007 | 135,918 | 210,714 | (74,796) |
| 2006 | 133,722 | 198,253 | (64,531) |
| 2005 | 120,248 | 170,109 | (49,861) |
| 2004 | 110,731 | 155,902 | (45,170) |
| 2003 | 97,412 | 138,060 | (40,648) |
| 2002 | 97,470 | 134,616 | (37,146) |
| 2001 | 101,297 | 131,338 | (30,041) |
| 2000 | 111,349 | 135,926 | (24,577) |
| 1999 | 86,909 | 109,721 | (22,812) |
| 1998 | 78,773 | 94,629 | (15,856) |
| 1997 | 71,389 | 85,938 | (14,549) |
| 1996 | 56,792 | 74,297 | (17,506) |
| 1995 | 46,292 | 62,100 | (15,808) |
| 1994 | 50,844 | 49,494 | 1,350 |
| 1993 | 41,581 | 39,918 | 1,663 |
| 1992 | 40,592 | 35,211 | 5,381 |
| 1991 | 33,277 | 31,130 | 2,148 |
| 1990 | 28,279 | 30,157 | (1,878) |
| AVERAGE | 119,766 | 156,196 | (36,430) |
| Source: United States Census Bureau – Foreign Trades | |
| Note: Figures are not seasonally adjusted | |
| TABLE 3: US Trade Value w/Canada ($ millions USD) | |||
| YEAR | EXPORTS | IMPORTS | BALANCE |
| 2016 | 266,797 | 277,756 | (10,958) |
| 2015 | 280,855 | 296,231 | (15,375) |
| 2014 | 312,817 | 349,286 | (36,469) |
| 2013 | 300,755 | 332,504 | (31,749) |
| 2012 | 292,651 | 324,263 | (31,613) |
| 2011 | 281,292 | 315,325 | (34,033) |
| 2010 | 249,257 | 277,637 | (28,380) |
| 2009 | 204,658 | 226,248 | (21,591) |
| 2008 | 261,150 | 339,491 | (78,342) |
| 2007 | 248,888 | 317,057 | (68,169) |
| 2006 | 230,656 | 302,438 | (71,782) |
| 2005 | 211,899 | 290,384 | (78,486) |
| 2004 | 189,880 | 256,360 | (66,480) |
| 2003 | 169,924 | 221,595 | (51,671) |
| 2002 | 160,923 | 209,088 | (48,165) |
| 2001 | 163,424 | 216,268 | (52,844) |
| 2000 | 178,941 | 230,838 | (51,897) |
| 1999 | 166,600 | 198,711 | (32,111) |
| 1998 | 156,604 | 173,256 | (16,653) |
| 1997 | 151,767 | 167,234 | (15,467) |
| 1996 | 134,210 | 155,893 | (21,682) |
| 1995 | 127,226 | 144,370 | (17,144) |
| 1994 | 114,439 | 128,406 | (13,967) |
| 1993 | 100,444 | 111,216 | (10,772) |
| 1992 | 90,594 | 98,630 | (8,036) |
| 1991 | 85,150 | 91,064 | (5,914) |
| 1990 | 83,674 | 91,380 | (7,706) |
| AVERAGE | 193,166 | 227,516 | (34,350) |
| Source: United States Census Bureau – Foreign Trades | |
| Note: Figures are not seasonally adjusted | |
| TABLE 4: NAFTA Trade Value ($ millions USD) | |||||
| YEAR | EXPORTS | IMPORTS | BALANCE | EXPORT % GLOBAL | IMPORT % GLOBAL |
| 2016 | 496,499 | 571,812 | (75,312) | 34% | 26% |
| 2015 | 517,059 | 592,632 | (75,572) | 34% | 26% |
| 2014 | 553,824 | 645,016 | (91,192) | 34% | 27% |
| 2013 | 526,709 | 613,060 | (86,351) | 33% | 27% |
| 2012 | 508,526 | 601,857 | (93,331) | 33% | 26% |
| 2011 | 479,580 | 578,198 | (98,618) | 32% | 26% |
| 2010 | 412,921 | 507,622 | (94,701) | 32% | 27% |
| 2009 | 333,550 | 402,903 | (69,353) | 32% | 26% |
| 2008 | 412,370 | 555,433 | (143,063) | 32% | 26% |
| 2007 | 384,806 | 527,771 | (142,964) | 34% | 27% |
| 2006 | 364,378 | 500,691 | (136,313) | 36% | 27% |
| 2005 | 332,146 | 460,493 | (128,347) | 37% | 28% |
| 2004 | 300,611 | 412,261 | (111,650) | 37% | 28% |
| 2003 | 267,336 | 359,655 | (92,319) | 37% | 29% |
| 2002 | 258,393 | 343,704 | (85,311) | 37% | 30% |
| 2001 | 264,721 | 347,606 | (82,885) | 36% | 30% |
| 2000 | 290,290 | 366,765 | (76,475) | 37% | 30% |
| 1999 | 253,509 | 308,432 | (54,923) | 36% | 30% |
| 1998 | 235,376 | 267,885 | (32,509) | 35% | 29% |
| 1997 | 223,155 | 253,172 | (30,017) | 32% | 29% |
| 1996 | 191,002 | 230,190 | (39,188) | 31% | 29% |
| 1995 | 173,518 | 206,470 | (32,952) | 30% | 28% |
| 1994 | 165,282 | 177,900 | (12,618) | 32% | 27% |
| 1993 | 142,025 | 151,134 | (9,109) | 31% | 26% |
| 1992 | 131,187 | 133,841 | (2,654) | 29% | 25% |
| 1991 | 118,427 | 122,194 | (3,767) | 28% | 25% |
| 1990 | 111,953 | 121,537 | (9,584) | 28% | 25% |
| AVERAGE | 312,932 | 383,712 | (70,781) | 33% | 27% |
| Source: United States Census Bureau – Foreign Trades | |
| Note: Figures are not seasonally adjusted | |
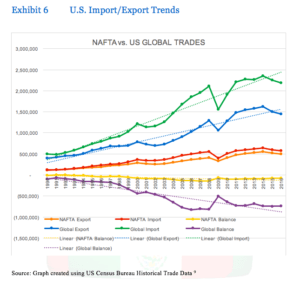
Source: Graph created using US Census Bureau Historical Trade Data 9
“The worst trade deal ever made” Donald J Trump – US President 1
“NAFTA agreement has made the overall sector much more competitive on a global basis” Bob Shanks – CFO Ford Motor Co. 2
“NAFTA has been around a long time, and it probably needs to be modernized, but it has been positive overall for America” Jim Lentz – CEO Toyota Motor NA 3
“I think anybody that is contemplating any big investment over the long term is probably either waiting or going to be biased to invest more in the U.S. until there is an outcome here” Don Walker – CEO Magna International 4
Tables and graphs in the Exhibits 2 through 6 were generated using the annual trade figures reported by the US Census Bureau